Your guide to the 4 essential analyses for creating Value Stream Maps - customer, value delivery, supplier and production control.
Written by: Nigel Richardson
Value Stream Mapping (VSM) is an invaluable tool in the arsenal of your Lean efforts, but before you can create your current and future state maps you must be in a position where you understand the different symbols, terms and analyses that must be conducted.
In this guide I will examine the four essentials you must have to be successful with VSM.
Understanding VSM sections and decomposing their content
Different sections of the VSM are related to the analysis and visualization of performance of distinct components or your business as per this list:
- Customer
- Value Delivery / Customer Journey
- Supplier
- Production (Monitoring Control and Decision Making)
A. Customer Analysis - top right
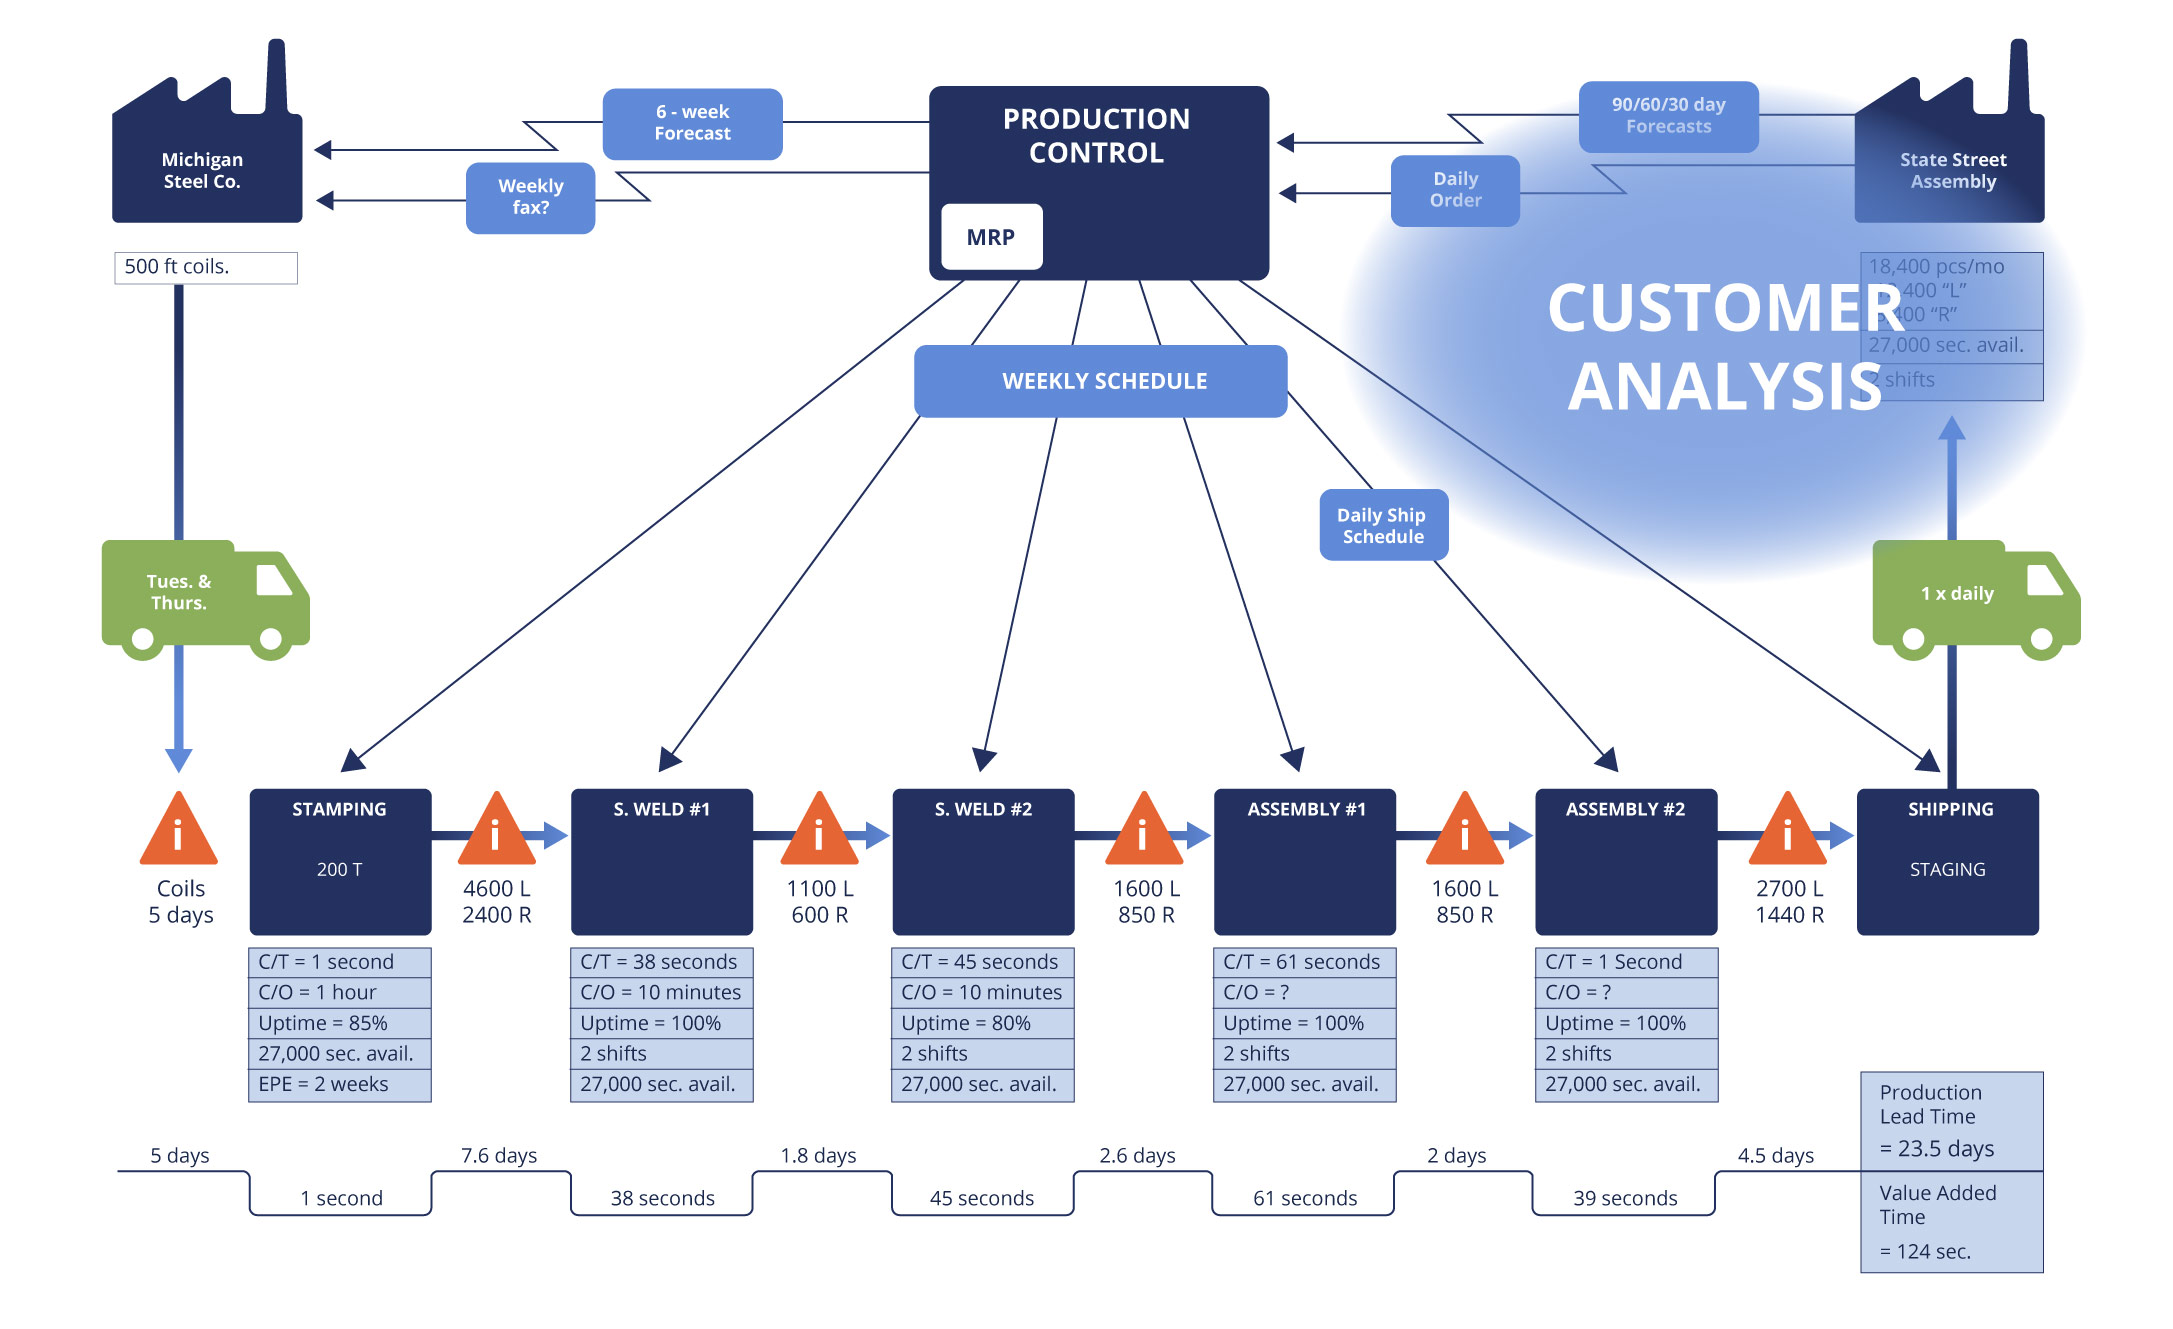
The Voice of the Customer can be broken down into two key components for customer analysis when considering the information to gather for your map:
i) What do customers expect as ‘good’?
Understanding what customers expect as ‘good’ is critical to understanding the level of performance that you are aiming for and also what requirements you may be able to modify should it help your overall performance improve.
Questions to ask:
- What defines a good product and service to your customers
- How are you performing to those expectations currently?
- Quality performance
- Delivery performance
- Price
- Ease of interaction
- What are their expectations for the future
- Do they have flexibility in their requirements?
- How are you performing to these expectations against current or expected industry norms
We introduced the Kano model in our overview of Lean, and this serves as a great tool to understand expectations of your customer base.
ii) How do your customers ‘order’ your product or service?
Understanding how customers ‘order’ your product or service is also critical to establishing the rate that you need to ensure your end to end process is able to support through the capacity that is in place within your manufacturing or service environment.
Questions to ask:
- What is the demand for your value stream and how accurate is it?
This will give you the insight needed to understand:
- Demand analysis against volume vs variability allowing allocation to such profiles as ‘Runners, Repeaters or Strangers’
- Understanding other sources of demand fluctuation such as seasonality
- Calculate ‘Average Daily Demand’ and be subsequently able to calculate ‘Takt time’ which is the rhythm that your operation needs to work at to meet demand.
- Do your customers provide a forecast? How good is it compared to your historic demand trends?
- Demand analysis against volume vs variability allowing allocation to such profiles as ‘Runners, Repeaters or Strangers’
- What is the ordering behavior such as the desired quantity, lead times and delivery slots
a. Does the customer have any flexibility to this ordering behavior?
B. Value Delivery Analysis (Physical Process Analysis) – across the bottom
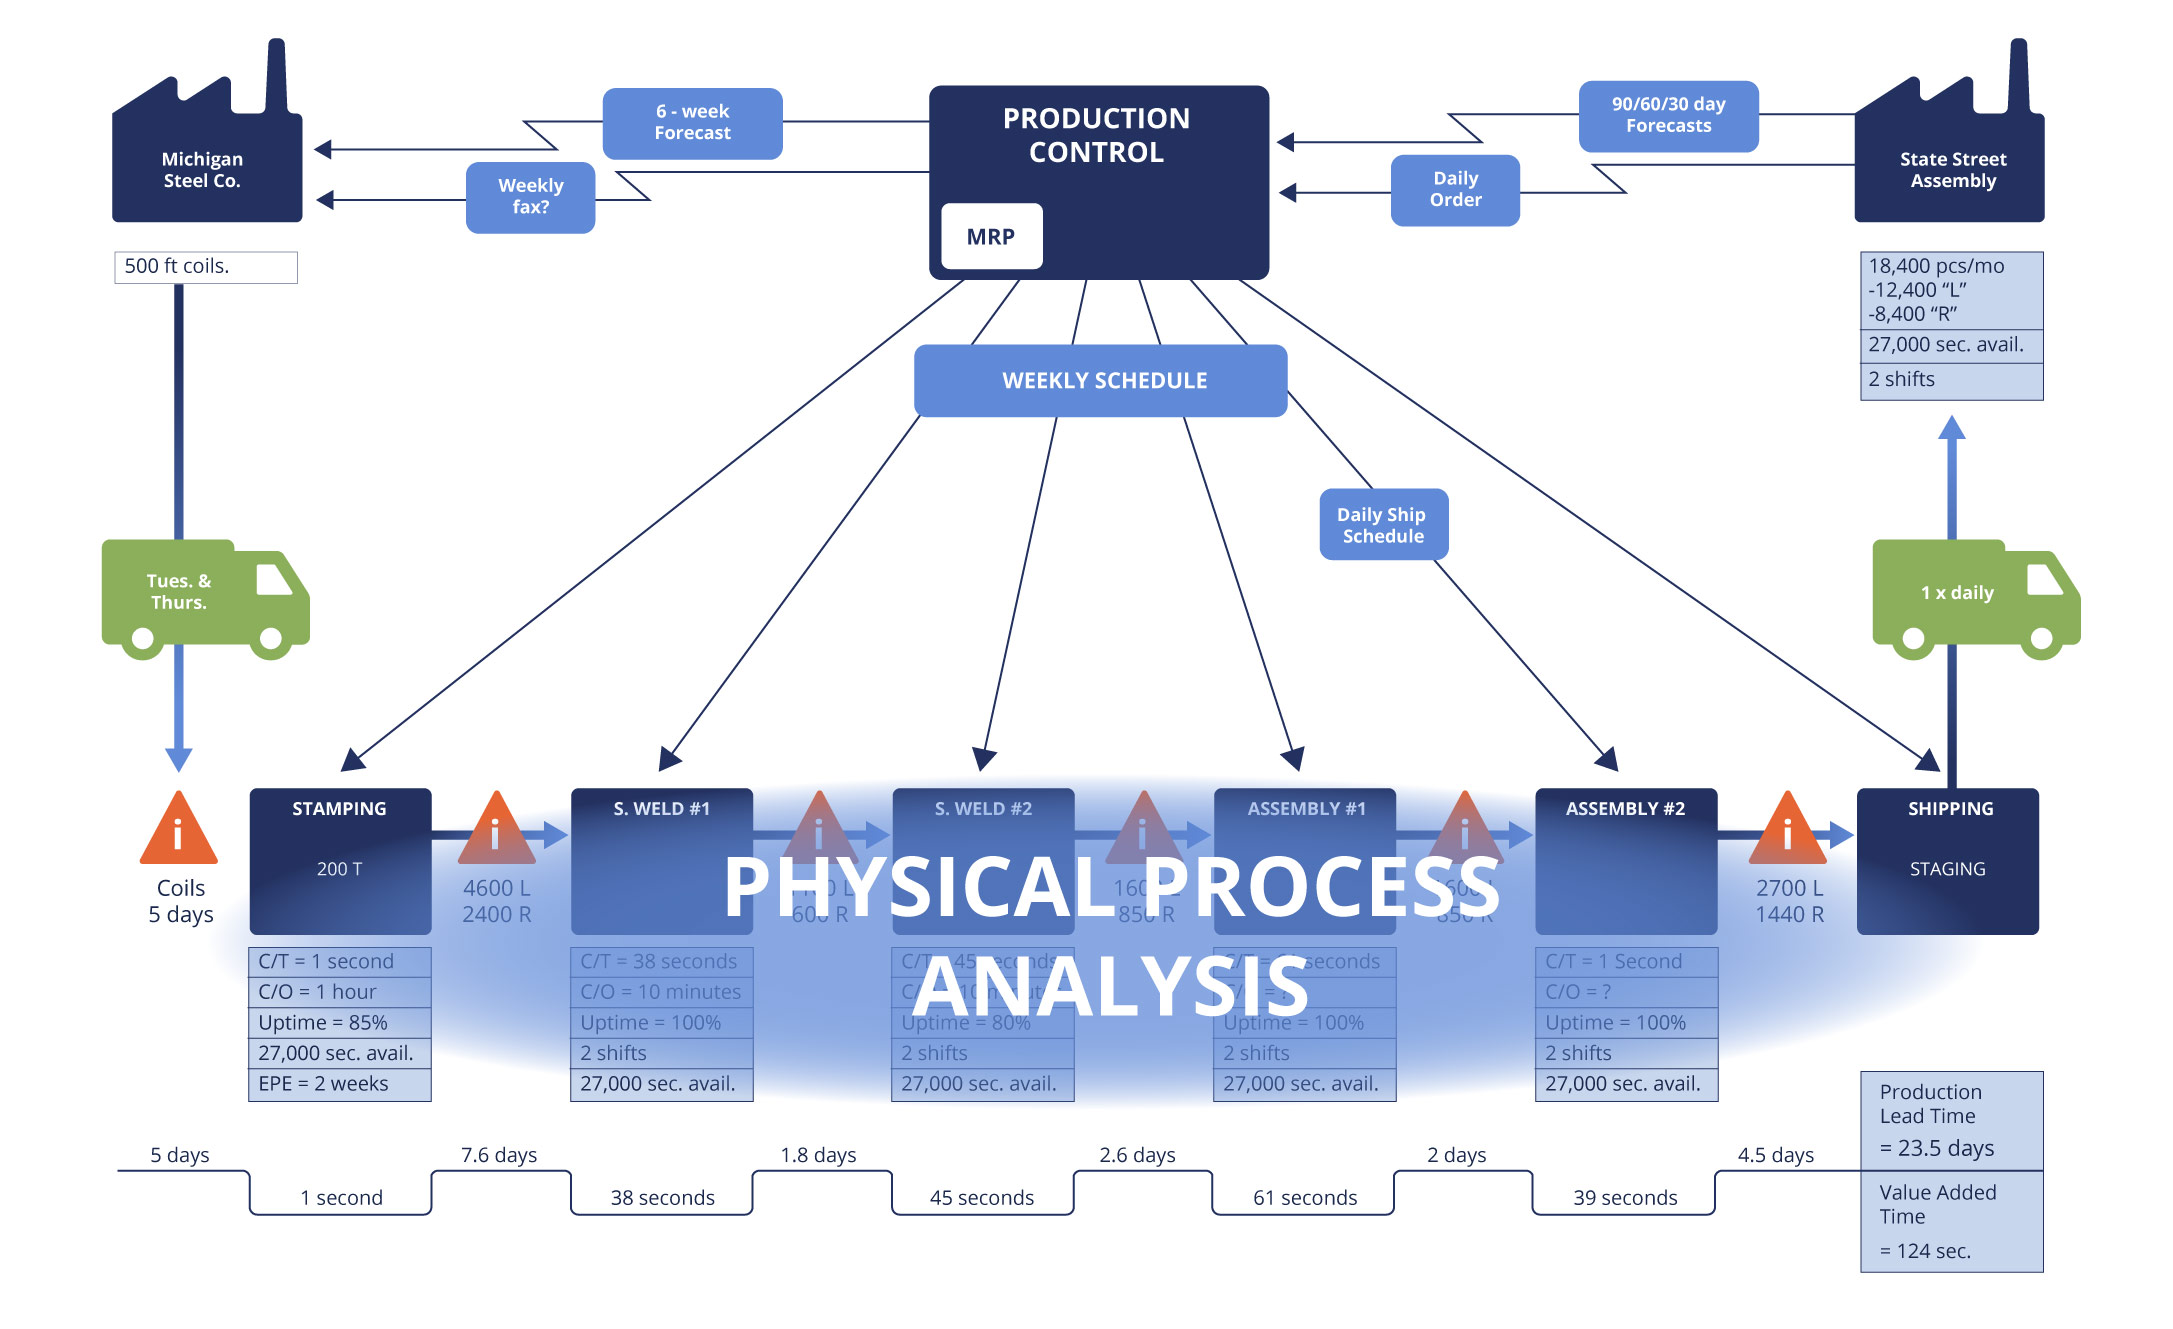
Consider this the scope of your ‘normal’ process map.
What are the logical process steps that your product goes through as it gets converted into the final product for dispatch from your site?
From a service perspective, what are the steps that a customer goes through in their service journey?
Remember in our earlier principles of CI article, y=fx.
Everything is an output of a function being applied to inputs.
Everything is a process, the challenge is to understand how it should work but then also see how it actually works.
The questions to ask:
1. How should value be delivered?-
- Historic Process maps
- Procedure documents
- Policy documents
- Layout documentations, floor plans, foot-prints
2. How is value actually being delivered?
-
- Process Observation
- 8 Wastes
3. How long do our processes take to be completed?
-
- This is the critical question when you are looking to understand and quantify value add vs non-value add, and understand end to end flow
- How long are products or customers waiting between process steps?
- Which process steps take the longest time and are acting as your current ‘bottlenecks’?
- Which process step will, through design constraints, always take the longest time and therefore serve as your ‘Pacemaker’?
-
- Quality
- Delivery
- Cost
Data and your VSM
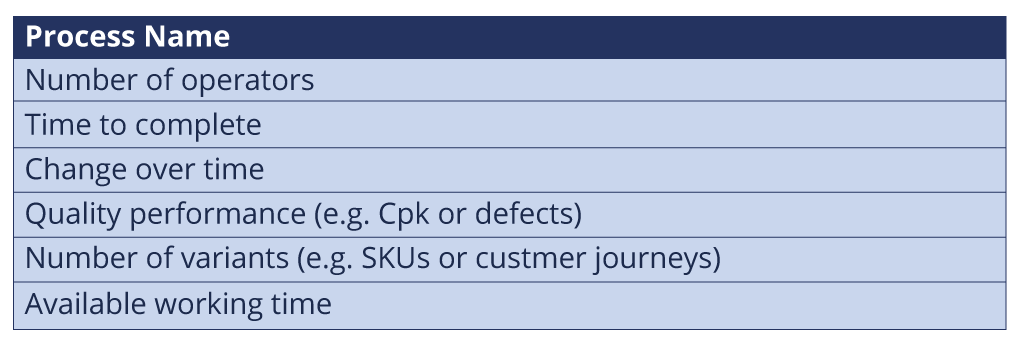
When it comes to your process analysis each process step will normally have actual performance data collected against the following ‘Process Data Box Structure’.
The data within will depend on the level of detail you apply to this section of the VSM.
I would encourage you to summarize these process steps where possible based on the assumption that you are focused on cross functional improvements for this exercise.
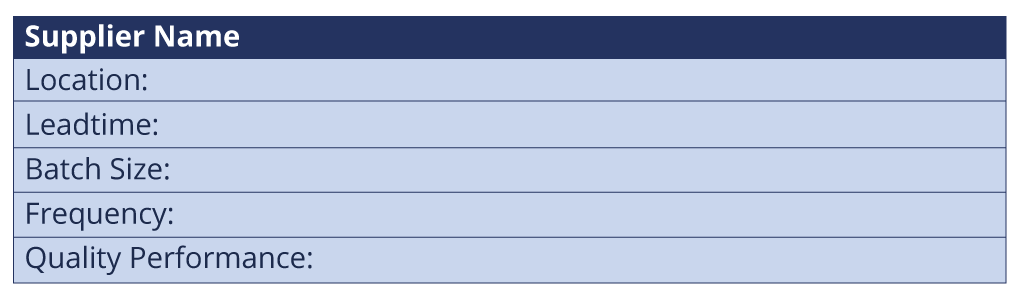
C. Supplier Analysis – top left
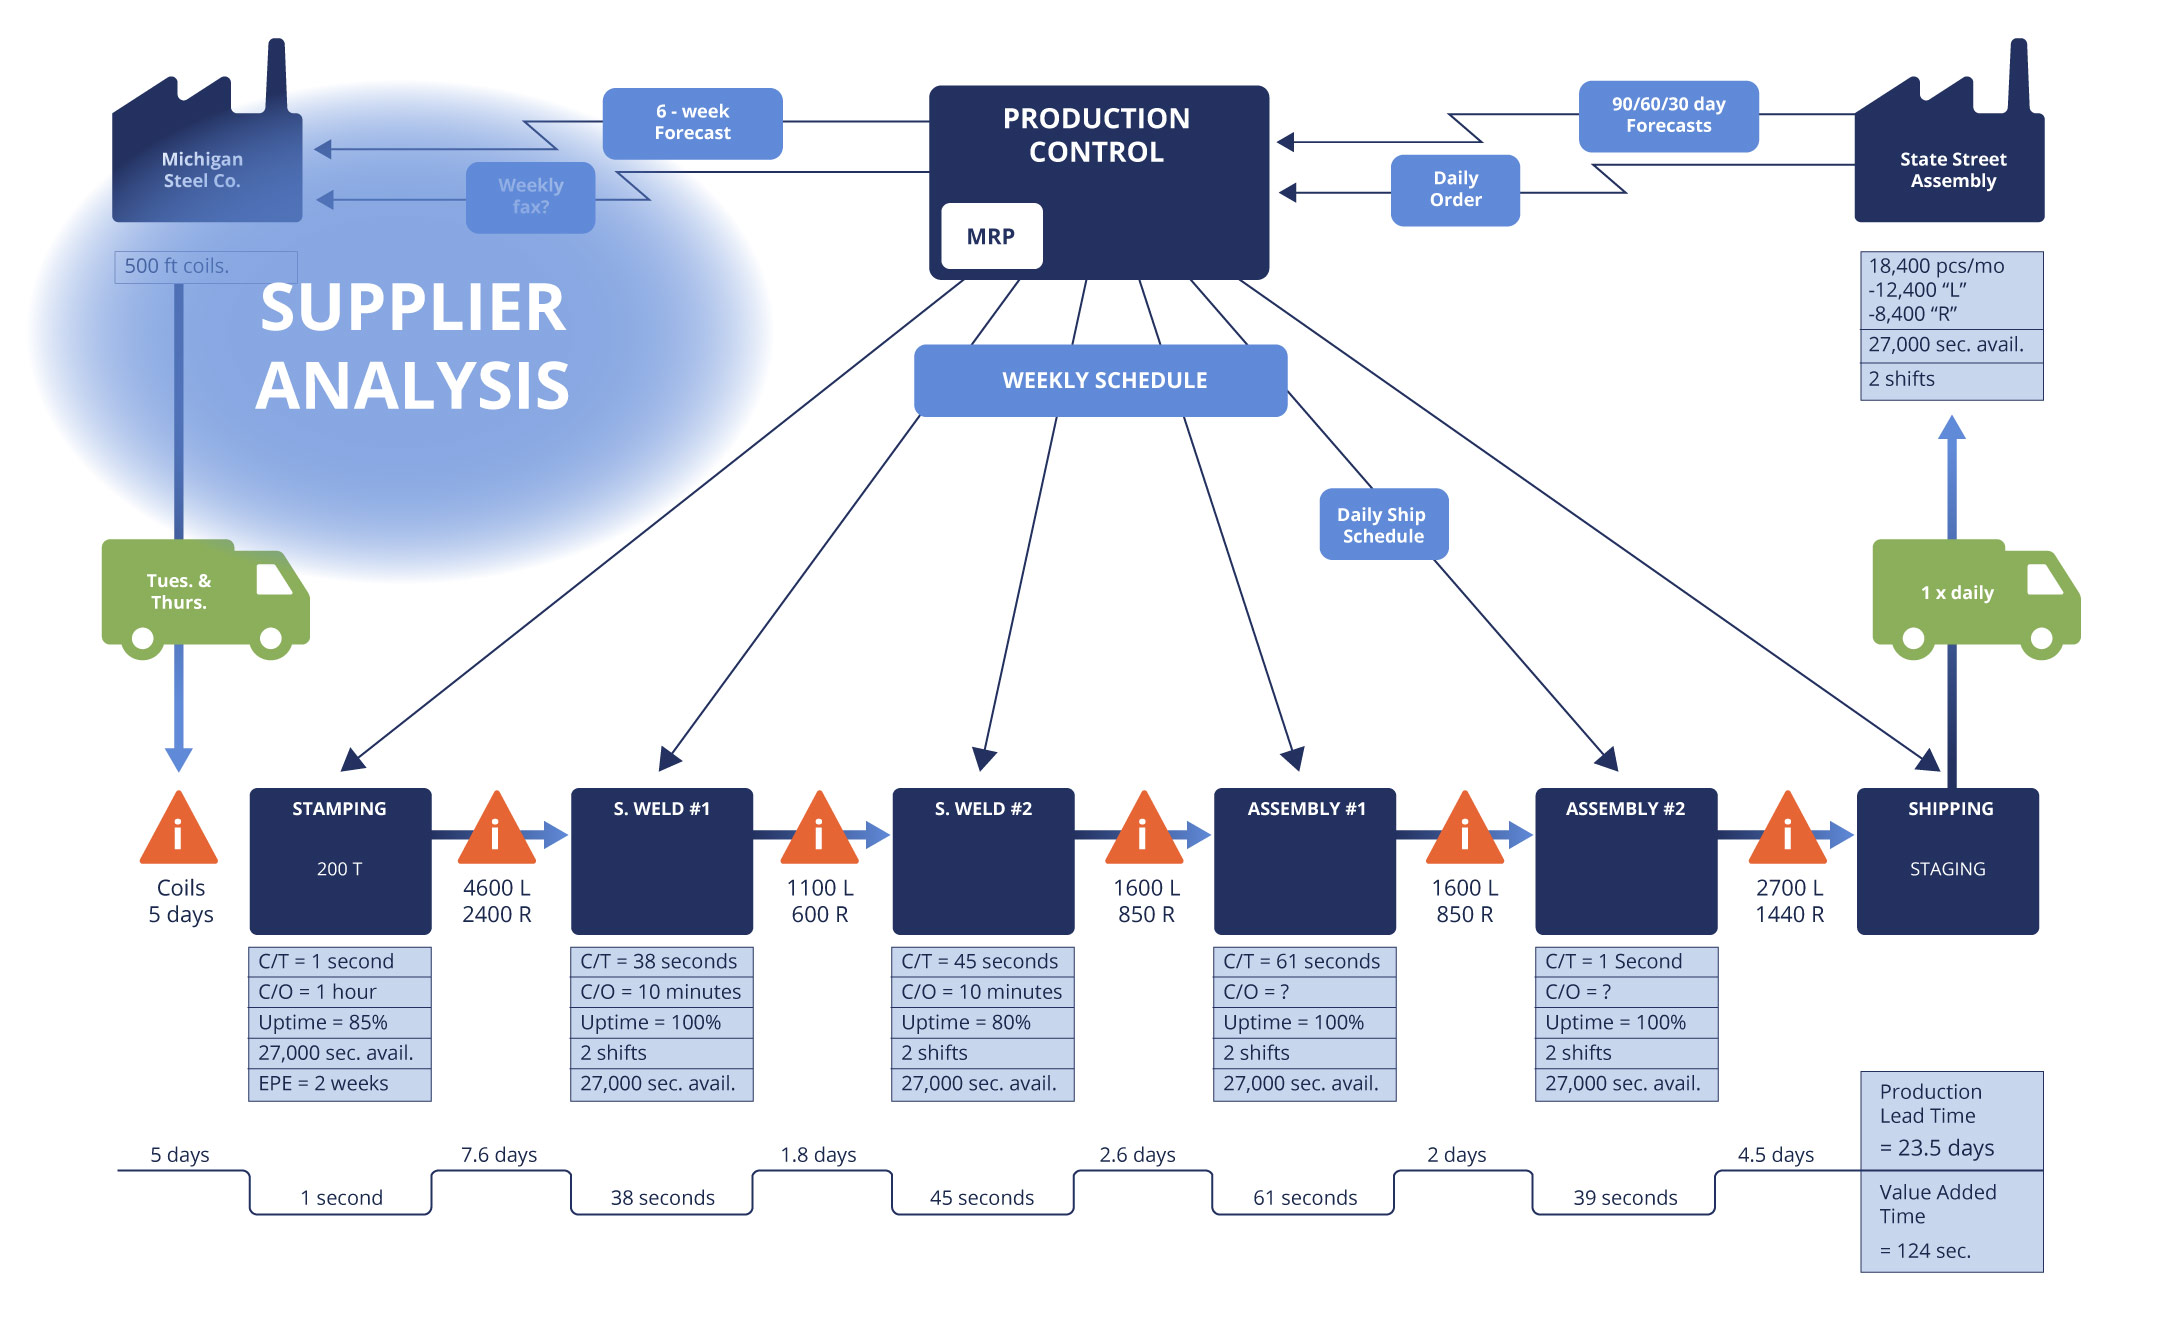
The top-level question is how many suppliers do we rely on for this Value Stream to be successful, and for each supplier we are looking for the following key information from a manufacturing / supply chain perspective:
Example: Conducting a supplier analysis in the service industry
A supplier analysis in the service industry is not as straight forward.
I have seen the following differing perspectives be applied and all have been successful providing there is agreement on the option used and definitions that sit behind that.
A. Supplier channels
What channels are the origins of your customer flow, maybe customers are referred from one or more third parties?
If so, what is their performance and lead times (e.g. how long has a customer been in the process from their perspective prior to them moving into the part of the value stream that you control)?
Is there any variability in your suppliers’ performance which may adversely impact on their customer feedback to your organization.
B. Supply of enabling IT
If your customer journey is supported by a large amount of technology, who are your technology suppliers and how are they performing in terms of SLA, up time, integration frequency or any other performance that could impact the customers experience of the service that you provide?
C. Supply of service providers
If your value delivery process requires a reliance on third parties to help deliver value (e.g. our house that needs repairing, our technology supplier that provides replacements), then ask:
- What are their response or lead times?
- What is their capacity able to take in terms of demand?
- What is the cost and how is that invoiced?
- What is the customer experience in terms of money out of their pocket to resolve a service issue (whether reclaimed or not)?
4. Monitoring, Control & Decision Making (Production Control) Analysis – in the middle
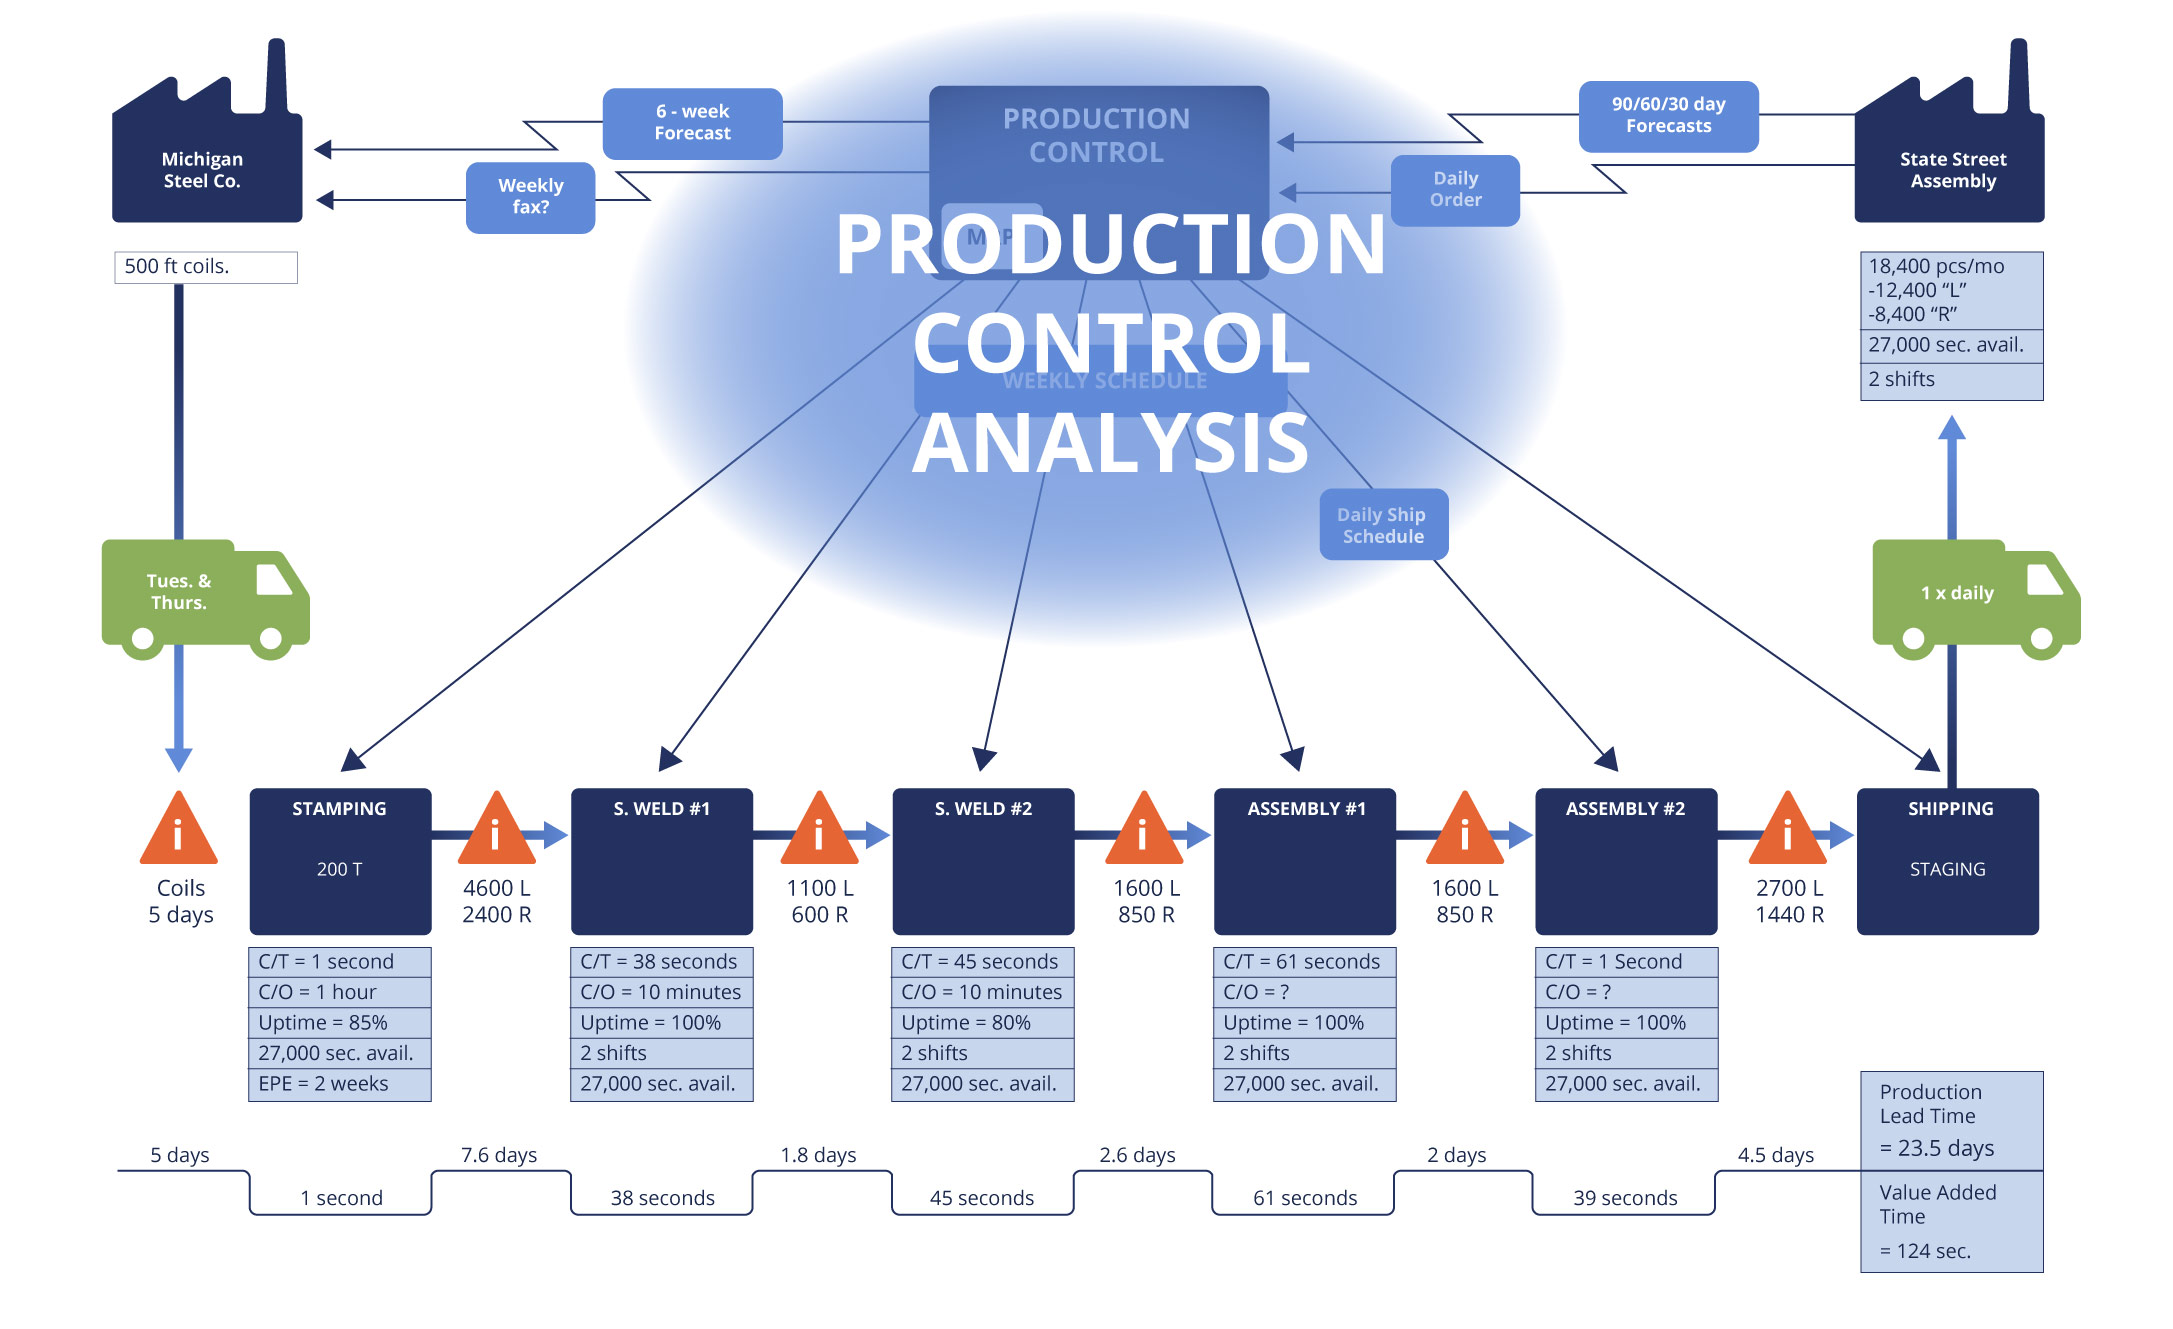
Questions to consider when understanding how your Value Stream is being monitored and controlled with informed decisions:
How does information flow, how frequent is this information, how robust and accurate is it?
B) How are you integrated with your suppliers?
How is information flowing between you and suppliers as per the customer questions?
C) How are you integrated with your own value delivery?
How is information on the actual performance flowing to this layer of business review and decision making?
D) How do you manage the demand you receive from customers?
-
- Are forecasts managed?
- Are abnormalities e.g. surges or reductions discussed and understood?
- Does any form of demand smoothing take place?
-
- Is capacity across the end to end process understood and managed?
- Are shifts in capacity understood in advance?
- Can capacity be transferred to different parts of the value stream in question?
- What are the delivery and planning horizons that exist for the value stream (e.g. daily, weekly, monthly, quarterly, 3-18 months)?
-
- What people and systems are involved in decision making related to capacity and demand across the various planning horizons that exist?
- What people and systems are involved in decision making related to capacity and demand across the various planning horizons that exist?
Once you understand how demand and capacity is being managed across the Value Stream you can explore cross functional consistency as an improvement opportunity, and how improvements within this space to the information flow will sustain any improvements that you implement in delivery.
Closing thoughts
Creating a VSM may appear to be daunting in scope, but with this practical guidance in mind I trust that feeling is replaced with clarity and enthusiasm.
When created with these guiding principles in mind, VSM is an incredibly beneficial technique, and one that can be used time and time again to drive down wastage.
Continue learning about continuous improvement
Click here to learn more about continuous improvement, or take a look at these content recommendations:
- Continuous improvement in 2020 and beyond: Watch how continuous improvement will evolve into the 2020s and how you can be successful.
- DMAIC v Six Sigma v Lean: Our guide to the steps and tools you'll need when driving process improvement through one of these three methodologies.
- The Leader's Guide to Continuous Improvement: Download this eBook to get a comprehensive overview of how DMAIC, Six Sigma, Lean, PDCA can support your business in finding competitive advantage.
About the author
Nigel Richardson is a continuous improvement expert. His background spans 20 years in business transformation and continuous improvement across retail, pharma, aviation and IT supply chain. He is passionate about supporting organizations to achieve their strategic, transformational and improvement goals, and outperform their peers year after year.
If you’d like to talk more about your strategic challenges, reach out to him on nigel.richardson@i-nexus.com or connect with Nigel on LinkedIn for the latest Strategy Execution insights.