In the world of constant change and remote working, organizational alignment, focus, and accountability of goals are key to success.
This blog looks at a superb tool for helping you to achieve both alignment and focus: the Hoshin Kanri x-matrix.
Written by: Carolyn Gibson, Senior Strategy Advisor and James Milsom
In my previous blog, What is Hoshin Kanri, I explained how Hoshin Kanri (called Policy Deployment) helps organizations construct, deploy and deliver on their strategic goals.
The x-matrix is Hoshin Kanri’s powerful visualization aid for managing detailed strategic planning. It is similar to other strategic planning tools, such as the Balanced Scorecard, OKRs, and OGSM.
However, the x-matrix has several key differences that make it head and shoulders above the rest in terms of building alignment, accountability, and focus. If you're wondering why, read on or jump to the section that you need:
- What is an x-matrix?
- What does an x-matrix look like?
- How can you build an x-matrix?
- Benefits of an x-matrix
- Challenges of an x-matrix
- Example x-matrix
- Evolving the x-matrix
- X-matrix software and Excel templates
What is an x-matrix?
An x-matrix is a tool used in Lean Six Sigma for strategic planning, process improvement, and problem-solving. It is a matrix that helps to organize and analyze data related to a process or project, with the goal of identifying opportunities for improvement and reducing waste.
The x-matrix consists of a grid with rows and columns. The rows represent the steps that take you from your true north (your vision) to your breakthrough, then annual goals and accompanying projects based on improving your performance and processes to achieve those goals.
The matrix cells contain data or information related to the above, such as the resource owners, outputs, and performance measures for each step.
The x-matrix is used to understand the relationships between the different process steps and variables and to identify the root causes of problems or inefficiencies. It can also develop and track improvement actions and monitor performance over time.
Overall, the x-matrix is a valuable tool for process improvement because it provides a visual representation of the process and helps identify and prioritize improvement areas.
What does an x-matrix look like?
As pictured below, a typical x-matrix (sometimes known as a Hoshin Matrix) is traditionally stored in an Excel file or printed on an A3 piece of paper.
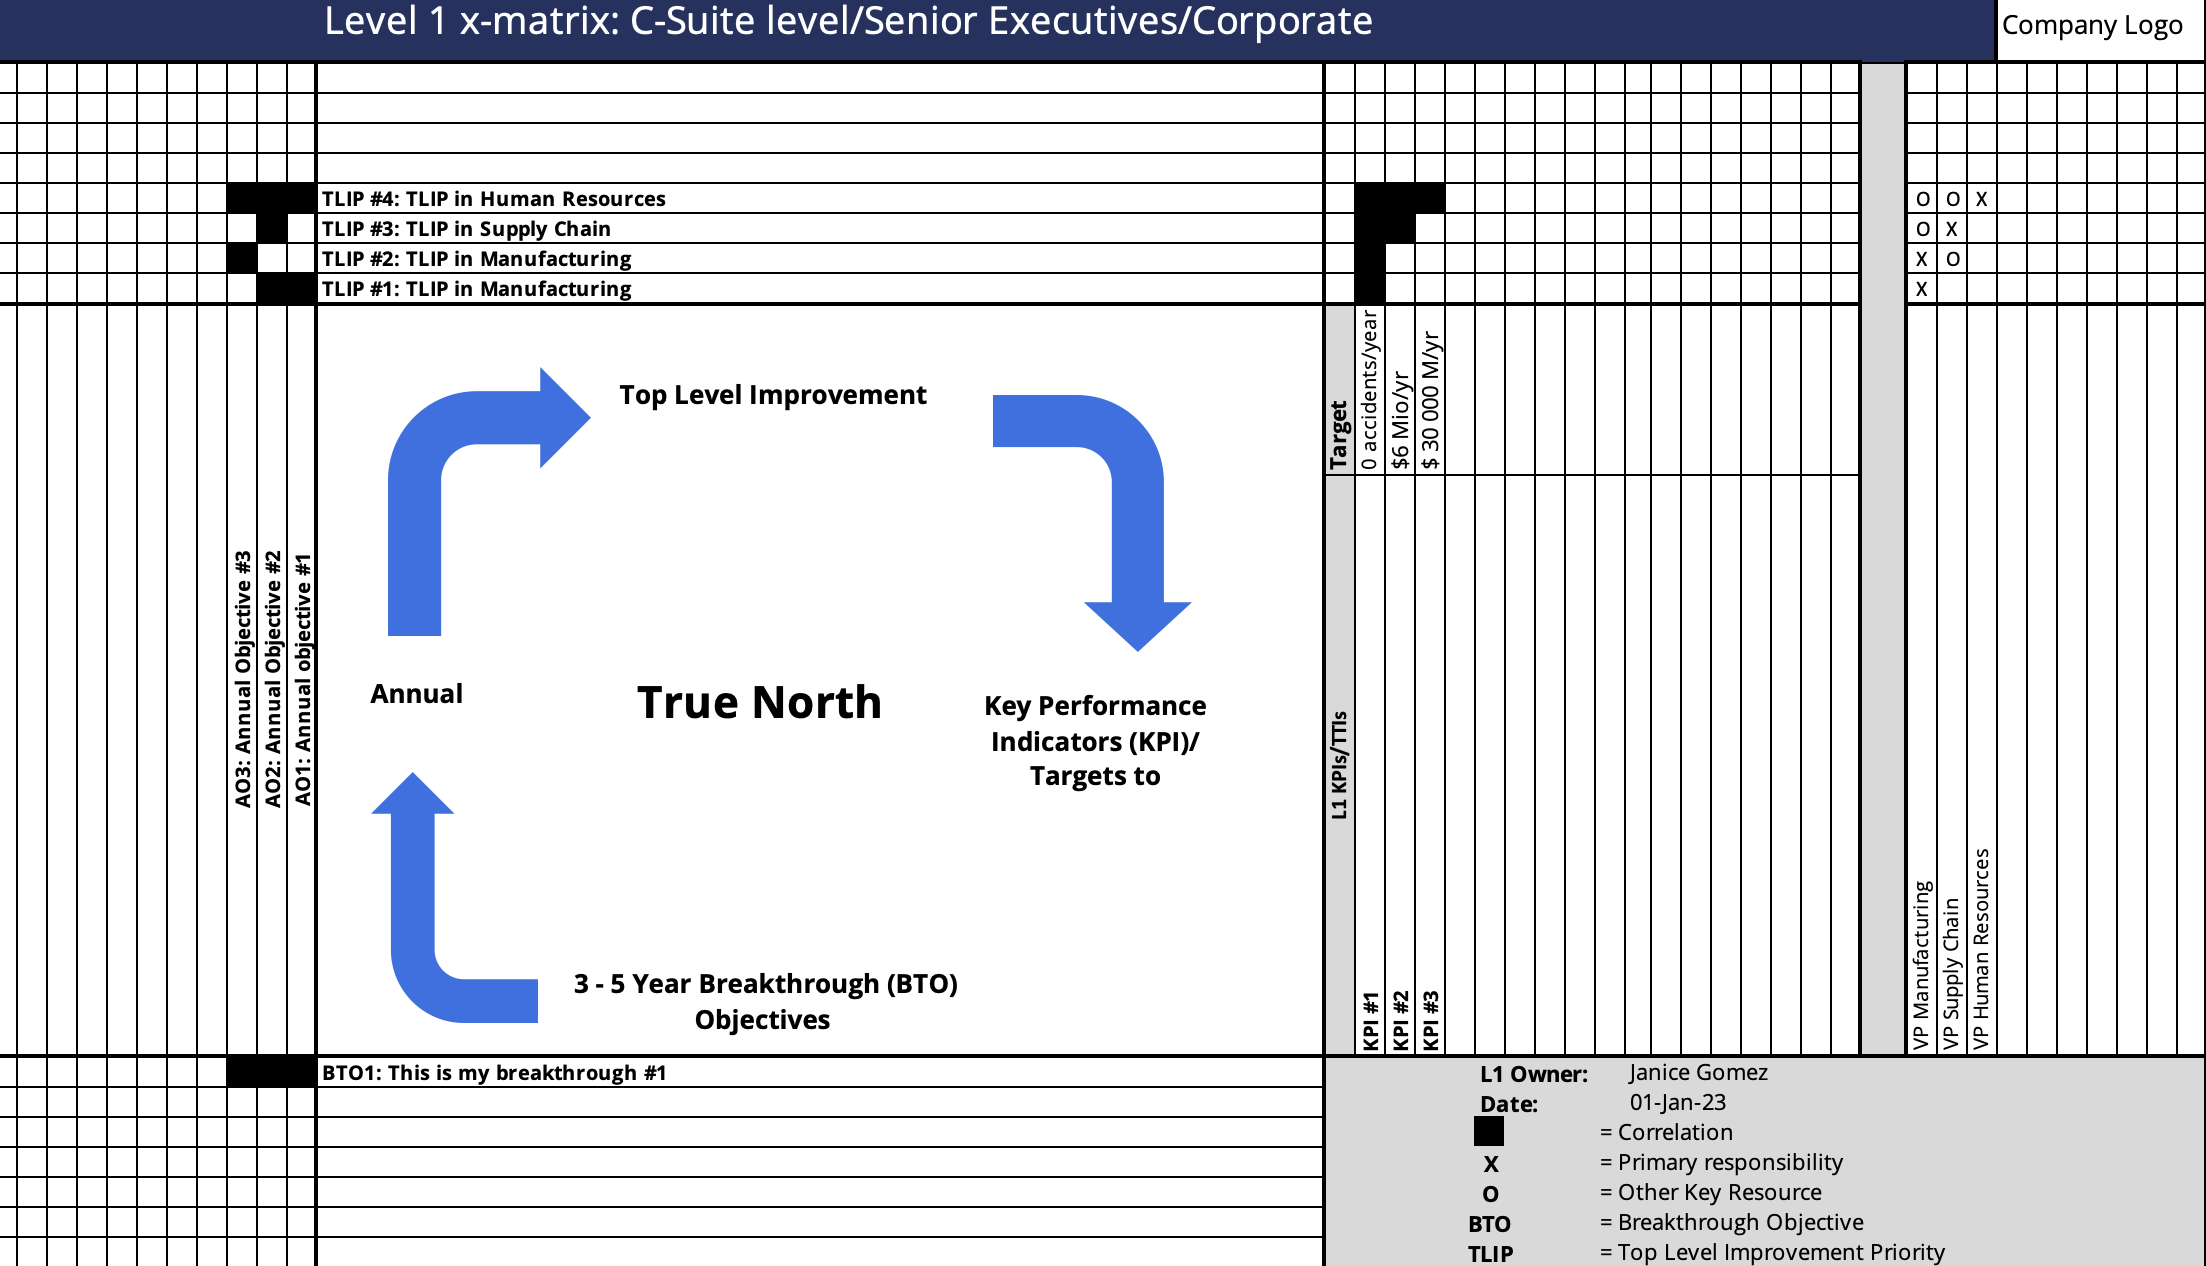
An example of an x-matrix spreadsheet
It can look complex to someone who has never seen an x-matrix before.
However, it has a simple but powerful underlying structure - a rhetorical wheel.
It unfolds around a point in the center of the square, where the company’s vision is displayed.
It then moves south and clockwise: from your vision to your three-year objectives, to your one-year objectives, to your next quarter’s priorities or goals.
It has containers for all the elements necessary to plan your strategy, including, on the east face, how the priorities will be measured and who will be accountable for their achievement.
How can you build an x-matrix?
Typically a leadership person in the organization determines the matrix (for example, an operations team). When building your x-matrix in a template, you must identify the most critical components following these steps.
1) Set the strategic vision and goals in the south quadrant
Start in a positive direction. In Hoshin Kanri, you'll have a three- to five-year age range, with breakthrough goals you want to achieve.
List these in the south (lower) quadrant of the matrix.
This is the "what" part of the plan. There should be no more than two or three breakthroughs set. As with any goals, these should follow the SMART methodology and can be assigned to strategic themes or portfolios, such as ESG, revenue, operational excellence, etc.
For example, suppose the x-matrix is used to analyze and improve a manufacturing site. In that case, the goals in the southern quadrant may include reducing defects, increasing efficiency, and reducing waste.
If the x-matrix is being used to analyze and improve a customer service division, the goals in the southern quadrant may include improving customer satisfaction, reducing response time, and increasing retention.
2) Set your annual goals in the west quadrant
Your team will then brainstorm and debate which annual goals will make the difference between the success and failure of each breakthrough, creating just three per breakthrough on the west face.
Through this strategic planning process, you'll generate intermediate goals for each year (with typically 50% of the value coming from the first year of a breakthrough). These must be achievable in the time frame, and be attached to a strategic theme or sit within a strategic portfolio, aligning to the true north of the organization.
For example, if the x-matrix is being used to develop a strategic plan for a manufacturing organization, the annual goals may include improving efficiency by 5%, reducing defects by 10%, and increasing yield by 15%. These goals would be linked to the breakthrough goal of becoming the industry's most efficient and highest-quality manufacturer.
3) Develop a portfolio of projects in the north quadrant
Moving into the north quadrant, you will create a laundry list of projects (or improvements) that need to be executed. These should be prioritized based on their ability to help you achieve your goals. This is the "how" part of the plan.
Classic portfolio management and prioritization are required to build and maintain this list.
Functional leaders and other key team members are often brought together to brainstorm and determine the key priorities in the next 100 days to achieve the annual objectives - and to agree on how success will be measured and who will be accountable.
In our example of a manufacturer with an annual goal to reduce defects by 10%, there are a number of projects which could be executed:
a) Quality control process improvement
This project could involve identifying and addressing bottlenecks or inefficiencies in the quality control process, such as by implementing new technology or revising standard operating procedures.
b) Training and education
This project could involve providing training and education to employees on quality control best practices, in order to improve their skills and knowledge in this area.
c) Equipment maintenance and upgrades
This project could involve improving the maintenance and upkeep of manufacturing equipment, in order to reduce the likelihood of defects caused by equipment failure.
d) Material and component sourcing
This project could involve identifying and sourcing higher-quality materials and components, in order to reduce defects caused by poor-quality inputs.
e) Customer feedback and complaints
This project could involve gathering and analyzing customer feedback and complaints, in order to identify common sources of defects and implement corrective actions.
f) Root cause analysis
This project could involve conducting root cause analysis to identify the underlying causes of defects and implementing corrective actions to prevent them from occurring in the future.
g) Supplier quality improvement
This project could involve working with suppliers to improve the quality of materials and components that are used in the manufacturing process, in order to reduce defects caused by these inputs.
These would all be ranked on a number of factors, such as cost, the effort involved, and resource demand elsewhere in the business. Once complete, measures and accountable owners are attached in the last step.
4) Metrics, owners, and interdependencies on the east - with catchball thrown in
In each corner - southwest, northwest, and northeast, dots are placed in the intersections to show the causal links and relationships between the strategic elements. These can be color coded to improve visual management.
The creative process is collective, as a team, adding and subtracting the different elements within the limitations of the diagram.
Hoshin relies on this process, called catchball, to fully explore potential objectives, detail what each means in measures and actions, and then make the hard decision to select or amend only the ones most likely to drive the vision forwards.
Adding, detailing, amending, and subtracting elements reveal the strategy throughout the planning process.
How to think about the x-matrix
Filling out the x-matrix requires lateral and vertical thinking, creative brainstorming, and logical deduction. However, by following these steps you can create real structure for building out the plan.
And, depending on your maturity, you can the connect corporate, functional, and multiple levels of plans to build an organization-wide structure and transparency.
The benefits of using the x-matrix for strategic planning
The x-matrix has some powerful features that other strategic planning and deployment tools, such as A3s and value stream maps, do not:
- It forces your organization to focus on a small number of goals: choosing what not to do is crucial, meaning that priorities are set, and resources will be maximized
- Using catchall creates both organizational alignment around and individual accountability for those choices
- It shows the clear linkage from vision through to the next quarter’s goals (“improvement priorities”) and, once again, means that any disconnects can be easily identified and goals or projects questioned based on whether they truly support the strategy
- By asking for a clear measurement of success, it forces people to describe and create SMART goals.
As a result, it forces you to ensure your journey towards your vision is supported by focused activity this quarter and that all activity supports your vision.
Any other activity (e.g., those pet projects) must be shelved or killed.
Three things the x-matrix doesn’t help you do
The x-matrix is a planning tool, but time and time again, I have seen it used for other purposes to which it is less well-suited. Please be warned that:
1. The x-matrix is NOT a communications tool
The average person in the organization does not want to have to look around and around the x-matrix to find his or her goal or activity for the quarter.
2. The x-matrix is NOT a performance management tool
Good performance management requires tracking progress over time, and there is no space for that on the x-matrix.
Hoshin Kanri has other tools available for strategy execution which I will introduce in upcoming blogs.
3. The x-matrix is NOT suitable for tracking business as usual continuous improvement activities
It is for managing major strategic initiatives.
It is reasonable that each area of the business has vital improvements it wants to make, regulatory requirements to meet, and other daily work to deliver.
All of these are important to the day-to-day running of the business, but they do not need to appear on the x-matrix; they can appear in a bowling chart/targets to improve the dashboard.
Common challenges with a traditional Hoshin matrix planning
The process is designed to ensure the right people are engaged at the right time to make the right choices. It is resource intensive by design, creating commitment and alignment.
When executing the policy deployment matrix template using traditional tools such as Excel or A3 paper, you typically face challenges such as:
- Some companies require visibility of breakthrough targets on their x-matrix.
In a static Excel x-matrix, it becomes nearly impossible to visualize the breakthrough and cascaded annual targets without conflating both the objectives and the targets. - For large organizations, it can be challenging to visualize the overlap of activities between different business areas, meaning gaps in the strategy are easily missed.
i-nexus offer Hoshin kanri excel template downloads. Be sure to download our x-matrix template and how-to guide for more challenges to be wary of.

Example of an x-matrix
While every x-matrix is different, even within industries, we all need to start somewhere. Here's an example of how you'd create an x-matrix for a life sciences organization:
1. Breakthrough goals
- Breakthrough 1 (BT1): Increase revenue 70% by the end of 2026
- Breakthrough 2 (BT2): Launch 3 new products within the next 24 months
- Breakthrough 3 (BT3): Expand international operations to 5 new countries within the next 36 months
2. Annual goals
- Annual goal 1 (BT1): Increase sales by 40%
- Annual goal 1 (BT2): Launch one new products on time and within budget
- Annual goal 1 (BT3): Establish operations in 2 new countries on schedule
*Running across each breakthrough: achieve regulatory approval for all products in key markets within 6 months of submission
3. Key initiatives / projects
- Launch a marketing campaign to promote new products
- Expand distribution channels in target markets
- Develop partnerships with key customers
- Invest in research and development to drive innovation and new product development
- Expand the sales team and improve sales training
- Streamline the regulatory approval process
4. Metrics
- New business sales
- Customer retention
- Customer growth
- Market penetration
- On-time delivery
- Leads
- Regulatory approval rate
5. Owners
- COO
- CRO
- CSO
- Director of Revenue
- Marketing Manager
- Sales Manager
- Site Manager
- Research Director
Things to remember:
Dependencies:
- Marketing campaign requires the development of marketing materials and budget approval
- Expansion into new countries requires negotiations with local partners and compliance with local regulations
- Partnership development requires identification and outreach to potential partners
- Investment in R&D requires budget approval and identification of suitable projects
- Sales team expansion requires recruitment and training resources
- Streamlining the regulatory approval process requires collaboration with regulatory affairs team and identification of bottlenecks in the current process
Assumptions:
- Market demand for the new products is sufficient to meet the revenue goal
- The organization has the resources and capabilities to successfully launch and sell the new products
- The organization has the necessary expertise and resources to establish operations in the new countries
- The regulatory approval process will proceed as planned, without any unexpected delays or obstacles
Note that this is just one example of an x-matrix and the specific elements included may vary depending on the needs and goals of the organization. The x-matrix is a useful tool for planning and tracking progress towards strategic objectives and can be customized to fit the specific needs of the organization.
Adapting the x-matrix format
Just as organizations tend to rename Hoshin Kanri / policy deployment to fit their internal terminology, they also tend to adapt the x-matrix to their own business and operating systems.
I have seen that organizations may call them aspirations, strategies, and tactics instead of breakthrough goals, annual objectives, and improvement priorities.
I have also seen organizations try to use the Southeast corner to tie their quarterly metrics back to their Breakthroughs.
While there are many variations, its key purpose remains the same: alignment, accountability, and focus.
X-matrix Excel templates and software
Due to its format, the x-matrix can be awkward to manage and display in Excel, although it can be done.
For a detailed guide on how to create an x-matrix, bowling chart, and action plan in Excel and the accompanying policy deployment matrix template, be sure to download our pack below:

Instead, Hoshin Kanri / policy deployment software has been designed as part of strategy software to make it easier to manage.
An example of the x-matrix in i-nexus strategy software can be seen below:
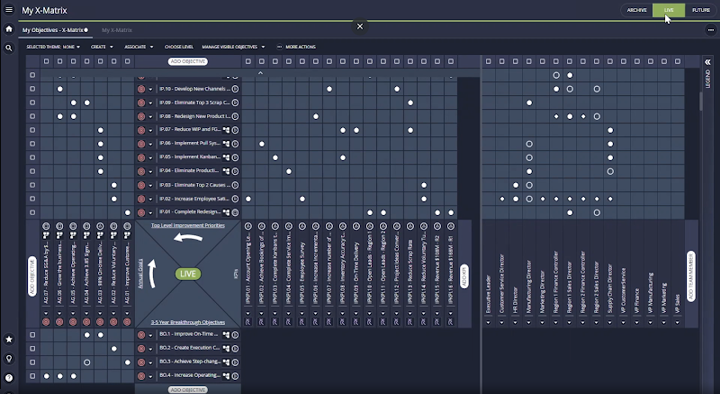
Aside from the formatting improvements, it means that much more information can be stored against the objectives (e.g. a detailed description) and the metrics (e.g., collection method and frequency, data sources, etc).
Such solutions also usually link the x-matrix to tools like the bowling chart.
Software that allows you to digitalize and rotate the x-matrix around its central point has several advantages:
1. Goals are cascaded more effectively and support the catchball process for total engagement
2. It allows you to assign accountable owners and measurements to any objective or goal, not just the quarterly priorities, providing additional rigor and buy-in
3. For larger organizations, it creates the opportunity to decompose quarterly priorities from the organization level down to the division or even team level, while maintaining alignment from the shop floor up to the vision
4. Hoshin / policy deployment software through i-nexus allows you to connect multiple x-matrices to ensure that the rigor and method are present throughout your organizational layers

Get the most out of your x-matrix
The x-matrix is a crucial weapon in the arsenal of a strategic planner, and used wisely, it is highly effective. In the context of Hoshin Kanri, however, it is just one of several superior visual aids.
Click here for further information on Hoshin Kanri, and stay tuned for the next blog on how Hoshin Kanri action plans are the essential bridge from strategy to execution.
And for those that have created their x-matrix and action plan, download a copy of our bowling chart Excel template to execute and track your strategy.
For more, continue your policy deployment journey with these recommendations:
- The complete Hoshin Kanri excel template pack: Download our x-matrix, bowling chart, action plan, and root cause analysis Excel template and PDF guide pack.
- Hoshin Kanri - OGSM - OKR: A case of apples and oranges?: Uncover the similarities between Hoshin Kanri, OGSM and OKR in our comparison eBook.
- Digitalize your x-matrix: We all know the shortcomings of x-matrix Excel sheets, but how can you break through and achieve a true step-change in your Hoshin planning and execution? Enter the i-nexus x-matrix and this 30-minute webinar.
About the authors
Carolyn Gibson is a senior strategy advisor and certified Hoshin Kanri facilitator working with Fortune 500 companies on building their strategy execution capabilities.
Her career spans disciplines, industries, and locations for over twenty years, with a golden thread running throughout of an obsessive focus on the mechanical detail of how organizations achieve their goals.
James Milsom is Head of Marketing at i-nexus. As Head of Marketing, his drive is to raise awareness and understanding of the challenges facing enterprises in delivering strategic objectives and transformation amidst changing markets and the obstacles traditional tools and methods present leaders.
If you’d like to talk more about strategy, reach out to James on james.milsom@i-nexus.com or connect with him on LinkedIn for the latest insights.