While Hoshin Kanri is a structured method for formulating, deploying, and executing your strategy, the actual execution and tracking must be supported by using the bowling chart, the metric A3, and the countermeasure A3.
Written by: Carolyn Gibson, Senior Strategy Advisor
Those of you who have followed my previous blogs know that Hoshin Kanri is a structured method for developing, deploying and executing your strategy. Indeed, we have already described the importance of identifiying Breakthrough Initiatives, and how the X-Matrix and the Action Plans help refine and strengthen the strategy prior to execution.
In this blog I will explain how the Bowling Chart, the Metric A3 and the Countermeasure A3 help support successful Strategy Execution.
The Art of Strategy Execution
Many companies come up with grand plans on what they want to achieve in the next period, and may even develop detailed plans, but they still fail. Why? Often it is not because the strategy was wrong, but because they lacked the discipline for consistent execution.
Good Strategy Execution has two main elements: consistent measuring and tracking of progress; and the discipline to get back on track when plans go awry.
The standards and processes for delivering this consistency and discipline are embodied in Hoshin Kanri execution toolset.
Tracking progress with the Bowler and A3
Defining the Bowling Chart
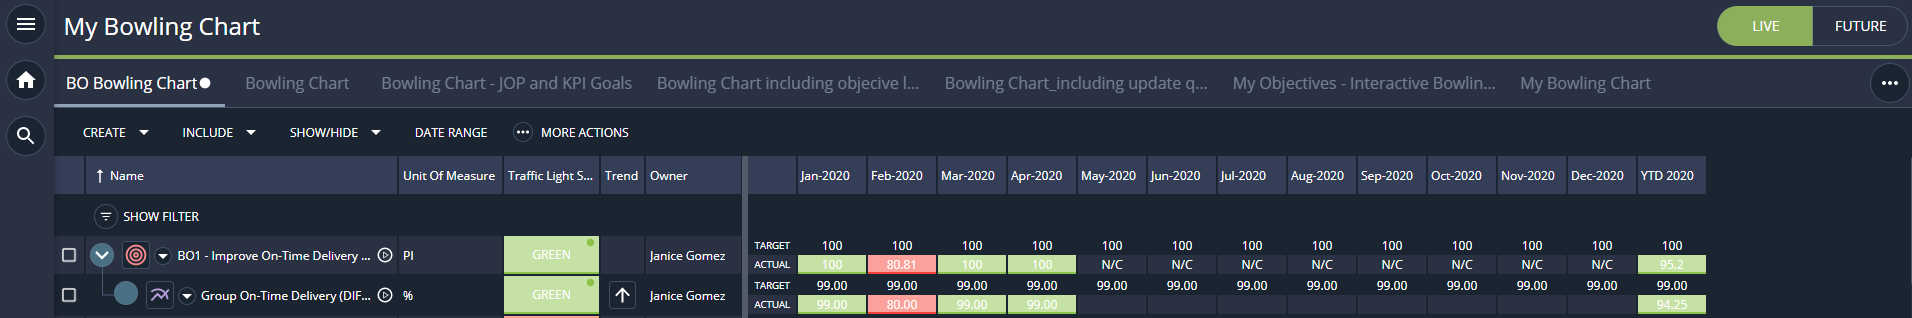
The Bowling Chart, sometimes called a Bowler, is so-named because it resembles the scorecard used in bowling.
It displays the performance of the key strategic objectives that you and your team are accountable for delivering, usually over the period of a year.
In the simplest version, you list your objectives on the left, and on the right for each of those objectives you record your monthly targets and actual results.
If you hit your target, the month is displayed in Green. If you miss your target, the month is displayed in Red.
As a manager, you can instantly see where there are problems, and work with your team to address them.
Of course, producing even this simple version takes a lot of planning and discipline.
The objectives need to be clearly defined so that you know exactly what to measure, and then you need to understand how you are going to measure it.
People using the Bowling Chart find that it is a great place for finding out where things might be going wrong. And if a metric does fail to meet target, they will then need more information.
Sometimes additional information can be made available directly in the Bowling Chart: a trend indicator is popular, as is a year-to-date column, but adding too much can take away from the simple green/red visual prompt.
Defining the Metric A3
Instead of the Bowling Chart, detailed information can be stored in the Metric A3.
Especially important is the metric chart, which helps visualize over time what the Bowling Chart numbers really mean, but also it can help to show the breakdown of data for contributing metrics (by region or by product, for instance)
The Metric A3 can also usefully include any formulas used to calculate the metric and accountabilities for collection and collation.
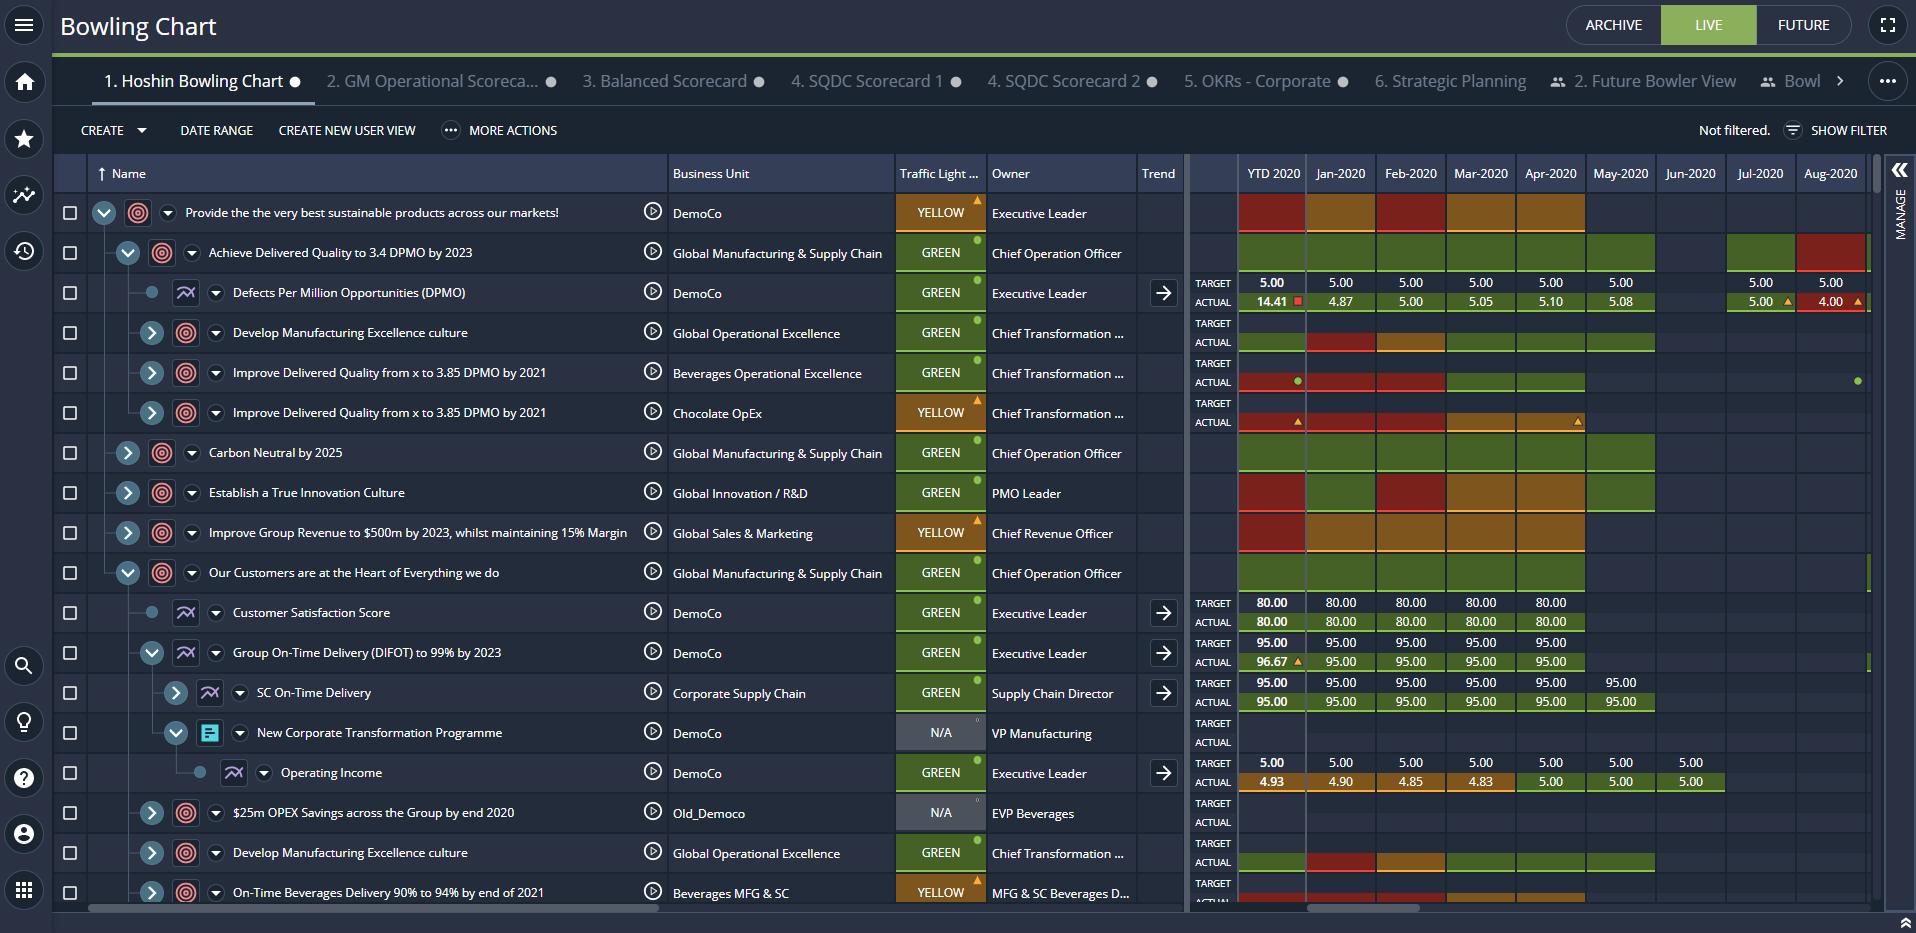
Example Bowling Chart
Below, we can see an example Bowling Chart within the i-nexus software.
Here, KPIs are set across multiple business levels, with a clear connection between a goal and the supporting KPIs on the left-hand side.
As we move towards the right, we see a traffic light status of red, yellow, green, the KPI owner, and a target.
Also included behind this is a Jump Off Point (JOP), which is the point at which measurement began.
Then moving to the far right, we can see the target and actual data, which will dictate, along with numerical settings, whether you are on track or off-target, as shown on the month by month Gantt to the right.
This Bowling Chart, or the KPI graph accessible in the below view, would become an integral part of your portfolio and program reviews. And, crucially, with the i-nexus Archive, Live, and Future functionality, you can refer to past, present, or future goals to track and review your Hoshin Kanri deployments.
Using the Bowling Chart and A3 Metric together
As you can see, the Bowling Chart and the Metric A3 are used together.
One is used to focus attention on areas requiring remedial action. The other gives further details about how the measurement is calculated and allow for further analysis and comparison.
Correcting your underperformance with the A3 Countermeasure report
When a target isn’t met, Hoshin Kanri immediately calls for root cause analysis.
Typical tools include the Ishikawa (or Fishbone) diagram and the Five Whys, both of which require that the user look beyond the symptoms of a problem to the true causes.
The Countermeasure A3 is designed to capture the results of this analysis and propose a solution.
It typically includes:
- The metric chart visually displaying the problem
- A problem description
- A pareto chart that shows the top root causes
- A list of actions that will be taken to address the root causes, and
- The impact of those actions on the problem and a timeline for improvement.
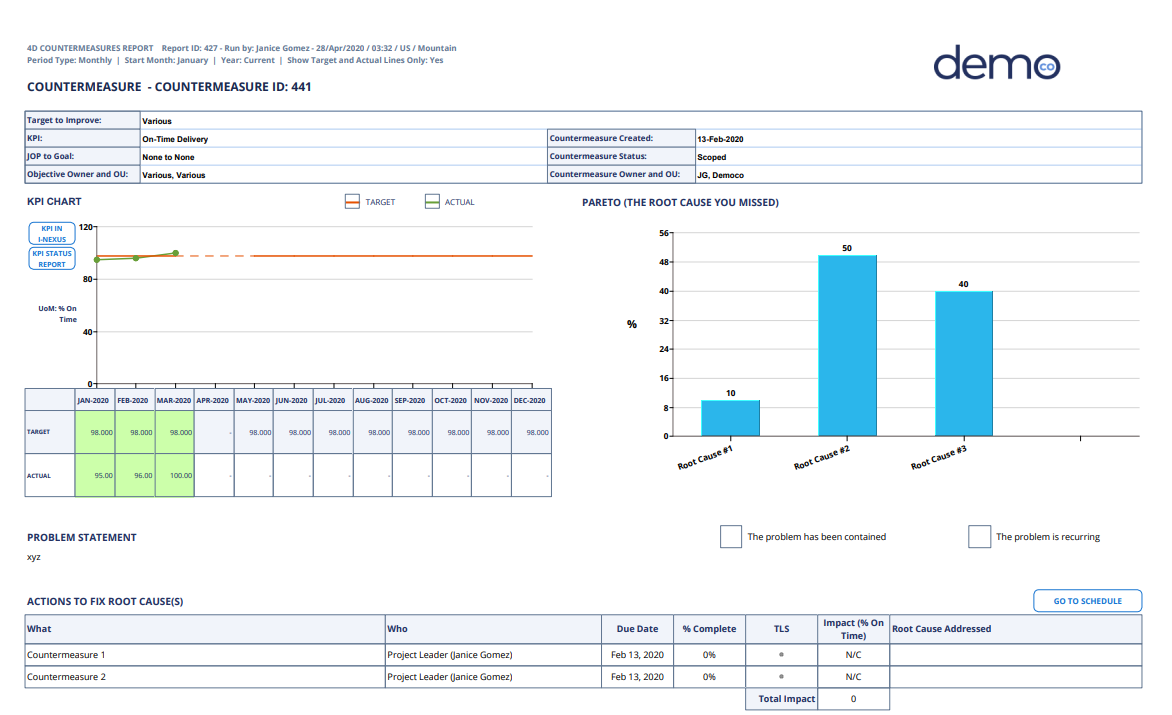
The Countermeasure A3 is not a detailed project plan, but more a list of quick, specific tasks directed at one or two key problem areas that the owner intends to resolve within a short period.
It is short, sharp and intent on instant results.
As a result, it is a very useful tool for keeping your teams focused and your plans on track.
Troubleshooting your Strategy Execution: A beginner’s guide
Good Strategy Execution can be hampered by a range of problems, and these can be amplified in large organizations. The most common ones are as follows:
- Lack of standards
It is not uncommon to find that every team in every department is using a different definition for the metrics or projects they are tracking. Creating consistency is necessary to ensure data integrity. - Data (and political) silos
A Bowling Chart is often made up of different types of objectives, and the data to measure these objectives will be the responsibility of different people, with different agendas, using different systems. Technical and political resistance must be overcome. - The blame game
“Seeing red” in the Bowling Chart shouldn’t make the executives “see red”. Where targets aren’t met, some managers punish the messenger. A learning and continuous improvement culture needs to be encouraged.

These problems can be solved, but require leadership from the top of the organization to break down political, logistical and cultural barriers.
They also may require internal or external expert support to help identify data and measurement problems.
Finally, a dedicated software package that can easily store and collate data and then present it in the different forms (Bowling Chart, Metric A3 and Countermeasure A3), with online access to all who need it, significantly improves communication and thus speeds up execution.
Building the capability for excellent Strategy Execution - the processes and standards, the tools and culture - starts with the CEO and extends right down the organization to the front line, where the problem-solving often happens.
This is why Hoshin Kanri is so powerful: it involves everyone in the organization equally in striving for results.
Take it from execution experts Charan and Bossidy:
“Execution is a specific set of behaviors and techniques that companies need to master in order to have competitive advantage. It’s a discipline of its own.”
Continue your Hoshin Kanri reading
Click here for further information on Hoshin Kanri, or continue your journey with these recommendations:
- The Hoshin Kanri X-Matrix: The What, How, Why, Benefits and more: Discover how the X-Matrix works and how you can make your own in our free Excel template
- Strategic Planning Template Pack: Download a copy of this strategic plan template pack and go step-by-step through the process of building your Hoshin Kanri, with guidance and examples of setting your True North, Breakthrough Objectives, and more, from within Excel.
- Gartner® Leveraging a Strategy Realization Office to Execute the Strategy: Read this Gartner® report to discover how to assess whether you need a Strategy Realization Office to deliver your goals, and how to plan its introduction.
- OKR v OGSM v Hoshin: Find out the role that your approach to strategy execution has on your ability to deliver mission-critical goals in this eBook.
About the author
Carolyn Gibson is a senior strategy advisor and certified Hoshin Kanri facilitator working with Fortune 500 companies on building their Strategy Execution capabilities. Her career spans disciplines, industries, and locations for over twenty years, with a golden thread running throughout of an obsessive focus on the mechanical detail of how organizations achieve their goals.

.jpg?width=352&name=seminar-594125_1920%20(1).jpg)